The amount of water in the soil determines the type of soil. There soil can be classified into four states depending on the water content of soil. They are as follows,
- Solid
- Semi solid
- Liquid
- Plastic
Nearly sixty years ago a chemist known as A.Atterberg defined three boundary levels between these four states. They are,
- Shrinkage limit
- Liquid limit
- Plastic limit.
Shrinkage limit is the boundary between solid and semi solid state, liquid limit is the boundary between liquid and plastic state and plastic limit is boundary between plastic and solid state. The classification of soil is very much important because to determine the engineering properties of soil in Construction technology. In each state the property of soil differs depending on water content. In this situation Atterberg limits helps to identify the state of soil. There are some laboratory tests to find the above mentioned boundary level limits. But in present situation two of the limits are experimented commonly for construction activities. They are plastic limit and liquid limit.
Liquid limit device, Porcelain (evaporating) dish, Flat grooving tool with gage, Eight moisture cans, Balance, Glass plate, Spatula, Wash bottle filled with distilled water, Drying oven set at 105°C.
Liquid limit test
- Measure the weight of moisture can and record it.
- Take an amount of soil in a porcelain dish and add some water in it. Mix them well until get smooth paste. (Soil was passed though a No. 40 sieve and air dried)
- Level the mixture in the porcelain dish as to get a depth of 1cm.
- Symmetrically divide the soil sample using the grooving tool.
- After that, rotate the handle of Liquid limit device so as to get two revolutions per second.
- Count the number of blows in which the separated soil sample come into contact to a length of 10mm.
- Take an amount of soil to moisture can from the above soil sample, where the groove disappeared.
- Measure the wet soil sample (+ moisture can) which is taken into moisture can.
- Keep the soil sample in oven and allow the soil to dry well.
- Measure the dry soil sample(+ moisture can) which is dried using oven.
- Empty the porcelain dish.
- Repeat the above same procedures to 5 or 6 times by adding water to the same sample.
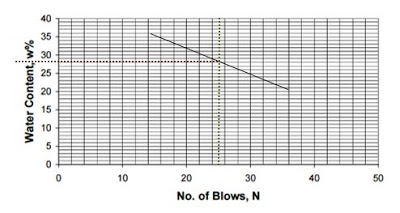
- Liquid limit is obtained by plotting graph to number blows (log scale) against moisture content.
Calculate the moisture content

Picture description of experiment

Description of atterberg Test step A,B
Steps C,D

Description of atterberg Test step C,D
Using the points of the graph draw the best straight line through them. Determine the liquid limit by considering the corresponding point on moisture content to the 25 blows.
(Note: According to Casagrande, who developed Atterbergs’ view stated from his experiments that the most exact moisture content is obtained when the number of blows is 25).
Example:
example of Graphs
From the graph, the liquid limit is 28.
Also see Plastic Limit test and examples
View all soil experiment and calculations


